What is balance sheet?
A balance sheet is a financial statement that presents a company's assets, liabilities, and shareholders' equity (also called net worth). Along with the income statement and cash flow statement, it forms the foundation of a company's financial reporting.
For shareholders and potential investors, it is crucial to comprehend the structure of the balance sheet, how to interpret it, and the fundamentals of analyzing it. Understanding the information presented on a balance sheet, stakeholders can gain insight into a company's financial health and make informed investment decisions.
A balance sheet is a financial statement that presents a company's assets, liabilities, and shareholders' equity
How Balance sheet work?
A balance sheet is a financial statement that provides a snapshot of a company's financial position at a particular point in time. It presents a company's assets, liabilities, and equity, and shows the balance between them.
Here's how the balance sheet works:
- Assets: The balance sheet starts with a list of a company's assets, which are resources that the company owns or controls. Assets can be tangible, such as buildings, equipment, or inventory, or intangible, such as patents, trademarks, or goodwill.
- Liabilities: Next, the balance sheet lists the company's liabilities, which are obligations that the company owes to others. Liabilities can include loans, accounts payable, and taxes owed.
- Equity: The last section of the balance sheet shows the company's equity, which is the difference between the assets and liabilities. Equity represents the amount of value that belongs to the owners of the company. It includes common stock, retained earnings, and other reserves.
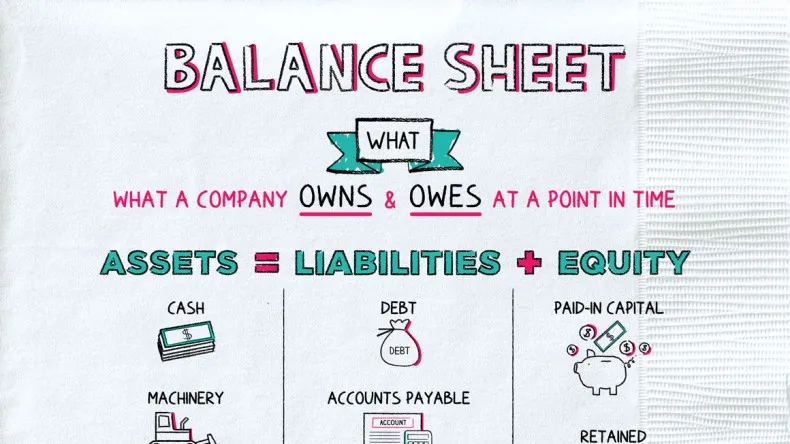
The balance sheet equation is: Assets = Liabilities + Equity
This equation must always be in balance. If there is a discrepancy between the assets and liabilities plus equity, it means there is an error in the financial statements. For example, if a company has a lot of debt compared to its equity, it may be less stable and more risky. Conversely, if a company has a strong balance sheet with more assets than liabilities, it may be in a good position to weather economic downturns or invest in growth opportunities.
Balance Sheet Analysis: The way to do it?
Analyzing a company's balance sheet is a crucial step in evaluating its financial health. One of the most effective techniques for assessing a balance sheet is financial ratio analysis. Financial ratios use formulas to gain insight into a company's financial condition and operational efficiency.
One important ratio for Balance Sheet Analysis is the debt-to-equity (D/E) ratio. This ratio compares a company's total liabilities to its shareholders' equity. Generally speaking, a D/E ratio under 2.0 is favorable as it indicates that the company has less debt and is less leveraged.
One of the balance sheet analysis example, Walmart's one for FY 2022 showed a D/E ratio of 1.84, indicating that the company had $1.84 of debt for every dollar of equity value. Walmart's large positive shareholders' equity value, over $83.2 billion, suggests that the company has a strong financial position and can meet its obligations.
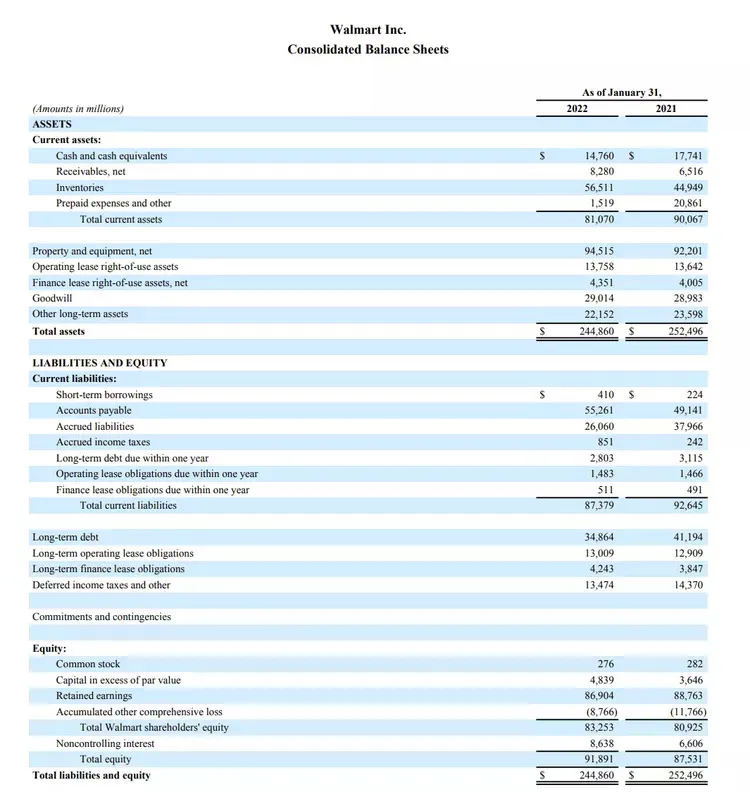
Source: Walmart.
There are several types of financial ratios that use information from a company's balance sheet. These ratios can be grouped into four main categories: liquidity ratios, solvency ratios, financial strength ratios, and activity ratios.
- Liquidity ratios: provide insights into the company's ability to pay off its short-term debts and obligations with its existing assets. These ratios include the current ratio, which measures the company's ability to meet its short-term obligations using its current assets, and the quick ratio, which focuses on the company's ability to pay off its current liabilities using its most liquid assets.
- Solvency ratios: provide insights into the company's ability to meet its long-term debts and obligations. These ratios include the debt-to-equity ratio, which measures the company's leverage by comparing its debt to its equity, and the interest coverage ratio, which shows how easily the company can cover its interest payments using its earnings.
- Financial strength ratios: such as the working capital ratio and the debt-to-assets ratio, provide insights into the company's overall financial strength and stability. The working capital ratio measures the company's ability to cover its short-term obligations with its current assets, while the debt-to-assets ratio shows how much of the company's assets are financed by debt.
- Activity ratios: focus on the company's operational efficiency by analyzing how quickly it can turn its assets into cash. These ratios include the accounts receivable turnover ratio, which shows how quickly the company collects payments from its customers, and the inventory turnover ratio, which shows how quickly the company sells its inventory.
By examining these financial ratios and comparing them to industry benchmarks and historical trends, investors can gain a more comprehensive understanding of the company's financial position, identify potential risks, and assess its long-term growth prospects. This analysis can also help investors make informed decisions about buying, holding, or selling the company's stock.
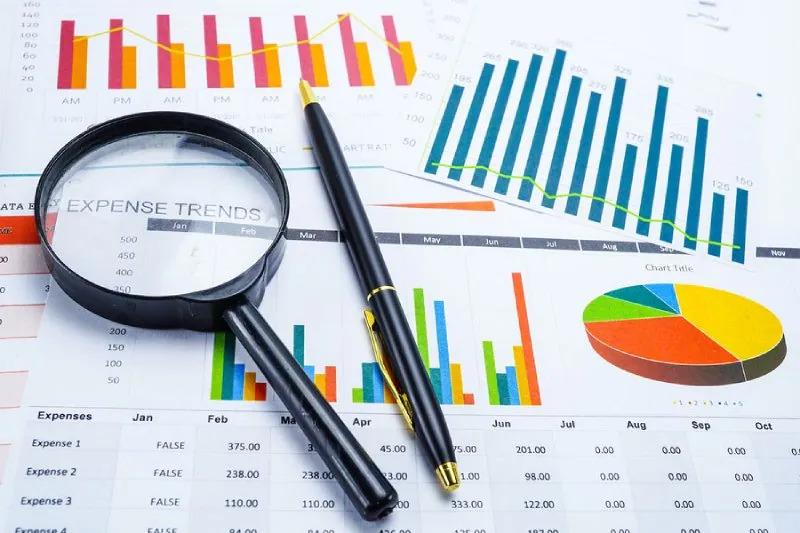
Four types of financial ratios: liquidity ratios, solvency ratios, financial strength ratios, activity ratios
Vertical vs. Horizontal Analysis of balance sheet
Vertical and horizontal analysis are two commonly used techniques for analyzing balance sheets.
Vertical analysis balance sheet, also known as common size analysis balance sheet, involves calculating the proportion of each line item on the balance sheet relative to a base figure, typically the total assets. By expressing each item as a percentage of total assets, vertical analysis allows for easier comparison of financial statements over time and between different companies. Vertical analysis can provide insights into the composition and structure of a company's balance sheet, identifying potential trends and risks.
Horizontal analysis of balance sheet, also known as trend analysis, involves comparing financial statement data over a period of time, typically several years. By looking at the changes in line items on the balance sheet, horizontal analysis can help identify trends and patterns, as well as potential strengths and weaknesses in a company's financial position. For example, a company with a decreasing inventory balance over several years may indicate that the company is becoming more efficient in managing its inventory.
Both techniques have their own strengths and limitations. Vertical analysis provides a snapshot of a company's financial position at a specific point in time, but it does not reveal changes over time. Horizontal analysis allows for the comparison of financial data over time, but it does not provide insights into the composition of the balance sheet.
To get a more complete picture of a company's financial health, it is often useful to use both vertical and horizontal analysis techniques. By using both techniques, investors can gain a more comprehensive understanding of a company's financial position and make more informed investment decisions.
Vertical and horizontal analysis are two commonly used techniques for analyzing balance sheets
Viindoo Accounting software: Easier and more efficient problem solved
Accounting program software can make the process of analyzing a balance sheet easier and more efficient:
Firstly, accounting software can automate the process of creating a balance sheet, by automatically aggregating all the relevant financial information and presenting it in a standard format. This saves time and reduces the risk of errors that may occur when creating a balance sheet manually.
Secondly, many finance and accounting softwares nowadays also provide various tools and features that can make analyzing the balance sheet easier. For example, some software may provide financial ratios and other key performance indicators (KPIs) that can help in assessing a company's financial health. Additionally, some software may allow for trend analysis, making it easier to compare balance sheets over different periods.
Finally, accounting software facilitates collaboration and data sharing between multiple users, such as accountants, auditors, and business owners. This can make it easier to gather and analyze financial information and ensure that everyone involved in the financial reporting process is on the same page.
Among the countless accounting software used in businesses today, Viindoo appears to be an enterprise resource planning (ERP) software that includes accounting and finance modules. It claims to provide various financial reports, including balance sheets, income statements, and cash flow statements.
While it is possible that Viindoo's finance and accounting software may include features that make balance sheet analysis easier, the effectiveness of the software will depend on various factors such as the complexity of the business, the user's knowledge of accounting principles, and the specific features offered by the software. It is important to thoroughly research and evaluate any accounting software before making a purchasing decision, to ensure that it meets the needs of your business and financial reporting requirements.


Replies to This Discussion